It’s often said that “numbers don’t lie.” If so, what does that reveal about personal finance in the USA? To answer that question, we’ve prepared this analysis of personal finance facts and statistics to help you understand approximately where you are in comparison with other Americans.
The information revealed in our analysis isn’t intended to make you feel insecure in any way. Instead, it’s designed to help set parameters that will enable you to see how you are doing and to make improvements where you believe it’s necessary.
We hope you like numbers because we have plenty of them! They’re a necessary evil, and they go with the territory when it comes to personal finance. We’re going to present statistics concerning multiple topics relating to income, debt, savings and budgeting, and financial planning.
The median household income nationwide is $79,900. However, there is a wide variation between the individual states. The following median household income statistics are provided by the U.S. Department of Housing and Urban Development as of April 18, 2022:
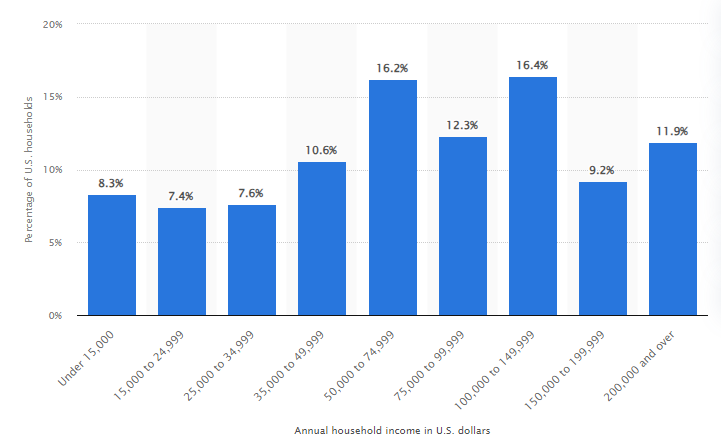
Have you ever wondered where your income falls among wage earners nationwide? For example, you may be interested to know that if your household income is over $200,000 per year, you’re among the 11.9% wealthiest households in the country.
According to Statista, the income distribution in the U.S. is as follows (for 2022):
According to the U.S. Census Bureau, 11.5% of the population – or about 37.9 million people – were below the poverty line in 2022.
According to the U.S. Office of the Assistant Secretary for Planning and Evaluation (ASPE), the poverty line for 2023 is as follows (based on annual income by household size) for most of the country:
Based on the table for “Median Household Income Per State” provided by the U.S. Department of Housing and Urban Development in the first section above, the top five richest states in the USA are:
Based on the table for “Median Household Income Per State” provided by the U.S. Department of Housing and Urban Development in the first section above, the top five poorest states in the USA are:
Your level of education also significantly impacts your income. According to the Bureau of Labor Statistics (BLS), income per education level for 2022 is as follows:
According to the U.S. Bureau of Labor Statistics, median earnings by age bracket are as follows (for the third quarter of 2023):
Average annual consumer spending in the USA was $72,967 in 2022, according to the Bureau of Labor Statistics.
The biggest individual category expenses were:
The state of consumer debt in the United States is both substantial and multifaceted, as indicated by statistics from the Federal Reserve Bank of New York for the third quarter of 2023.
The total consumer debt has reached a staggering $17.29 trillion, encompassing home mortgages, student loans, credit cards, and auto loans. Drilling down into these figures, the nation’s credit card debt accounts for $1.079 trillion of this total.
On average, a family carries $6,120 in credit card debt, with 45.20% of American families having some level of credit card debt. The interest paid by the average American household on credit cards is a high 22.77% annually.
This figure suggests a potential lack of awareness among consumers about the total interest they pay due to the complexity of managing multiple credit cards and the fluctuating nature of balances and interest rates.
The issue of debt extends into the realm of transportation and education. Approximately 1.2 million car repossessions occurred in 2022, as reported by Bloomberg, typically within 90 days of a loan default.
On the education front, student loan debt has surged to a record $1.77 trillion at the outset of 2023, with about 45.3 million students and graduates owing an average of nearly $30,000. Parent borrowers have taken on an average debt of $37,200 to finance their children’s education.
Bankruptcy also features prominently in the American financial landscape. Annually, 418,724 Americans file for bankruptcy, with personal bankruptcies constituting 403,000 of that number.
Chapter 7 bankruptcies, which entail the liquidation of assets, accounted for 239,125 cases, signifying complete insolvency. The remaining 173,362 were Chapter 13 bankruptcies, often involving reorganization and installment plan settlements.
These figures provide a stark illustration of the financial challenges facing many Americans.
Recent surveys and financial reports shed light on the state of American savings and budgeting behaviors, painting a somewhat concerning picture of the financial stability of many households.
According to Statista, as of the latest data, 12% of Americans have no savings at all, highlighting a significant portion of the population potentially vulnerable to financial emergencies.
Further emphasizing this vulnerability, a 2023 CNBC survey revealed that 62% of Americans are living paycheck-to-paycheck. Alarmingly, this hand-to-mouth existence spans across income levels, including 10% of households with annual incomes exceeding $100,000.
In terms of financial planning, Nerdwallet reports that only 74% of Americans maintain a budget, suggesting that a quarter of the population does not actively manage their spending against their income.
This lack of financial oversight may contribute to the stark reality that fewer than half of Americans — under 45% — have sufficient savings to cover an unforeseen $1,000 expense.
Instead of having a financial cushion, many would turn to credit cards, personal loans, or family and friends for financial assistance in such scenarios. The consequences of these precarious financial practices become further evident in the amount Americans pay in overdraft fees.
In 2022, individuals paid out $7.72 billion in such fees, with the burden primarily falling on those already identified as financially vulnerable, according to the Consumer Financial Protection Bureau.
When examining the average savings per American family, there’s a vast discrepancy at the state level. As of 2023, the national average savings stood at $65,100.
However, this average does not reflect the financial health of all states, with Arkansas averaging the lowest at $1,664 and the District of Columbia the highest at $2,806, suggesting significant regional disparities in economic well-being.
The landscape of retirement savings in the United States varies considerably by age, as detailed in the 2022 Federal Reserve data. The median retirement savings for American households stands at $87,000.
However, when these figures are broken down by age, it becomes evident that younger Americans, specifically those under the age of 35, are at a different stage in their retirement planning, with a median savings of $18,800.
The benchmarks for how much an individual should have saved for retirement by specific age brackets are not universally fixed and tend to be somewhat subjective. The general guidance is predicated on one’s current income, presuming it is adequate to manage living expenses comfortably.
This income is then multiplied by a certain factor intended to result in a sufficient nest egg by the time one retires at age 65. For instance, by the age of 40, it is suggested that one should have saved approximately 1.5 to 2.5 times their current annual salary.
As individuals progress through different age brackets, the recommended savings multiplier increases to ensure that retirement savings grow in proportion to the approach of retirement age.
The landscape of personal finance in the United States is as diverse as its population. Median household incomes fluctuate significantly across states, revealing a country of economic contrasts.
Education continues to be a powerful determinant of earning potential, with higher levels of education correlating with increased income. However, despite reasonable earnings, many Americans are burdened with considerable debt and lack the savings necessary to weather financial emergencies.
The state of retirement savings varies widely by age, emphasizing the need for early and consistent financial planning. The statistics presented underscore the importance of financial education and the development of robust personal financial management skills.
They highlight both the challenges and opportunities that lie within managing personal finances, pointing to a need for individual responsibility and systemic solutions to support Americans in achieving financial stability and security.
The post Personal Finance Facts and Statistics appeared first on Good Financial Cents®.
The information revealed in our analysis isn’t intended to make you feel insecure in any way. Instead, it’s designed to help set parameters that will enable you to see how you are doing and to make improvements where you believe it’s necessary.
We hope you like numbers because we have plenty of them! They’re a necessary evil, and they go with the territory when it comes to personal finance. We’re going to present statistics concerning multiple topics relating to income, debt, savings and budgeting, and financial planning.
Table of Contents
- Income Statistics
- Expenses and Debt: The American Financial Burden
- Savings and Financial Planning: Are Americans Prepared?
- The Bottom Line – Personal Finance Facts and Statistics
Income Statistics
Median Household Income
The median household income nationwide is $79,900. However, there is a wide variation between the individual states. The following median household income statistics are provided by the U.S. Department of Housing and Urban Development as of April 18, 2022:
| State | Median Household Income |
|---|---|
| Alabama | $73,600 |
| Alaska | $102,200 |
| Arizona | $82,800 |
| Arkansas | $69,400 |
| California | $101,600 |
| Colorado | $105,800 |
| Connecticut | $112,600 |
| Delaware | $96,900 |
| District of Columbia | $144,800 |
| Florida | $79,300 |
| Georgia | $83,200 |
| Hawaii | $107,200 |
| Idaho | $80,400 |
| Illinois | $97,600 |
| Indiana | $82,100 |
| Iowa | $86,900 |
| Kansas | $87,800 |
| Kentucky | $73,600 |
| Louisiana | $72,400 |
| Maine | $84,800 |
| Maryland | $117,500 |
| Massachusetts | $120,400 |
| Michigan | $84,200 |
| Minnesota | $104,000 |
| Mississippi | $65,000 |
| Missouri | $81,700 |
| Montana | $81,200 |
| Nebraska | $89,000 |
| Nevada | $84,600 |
| New Hampshire | $108,000 |
| New Jersey | $117,500 |
| New Mexico | $68,700 |
| New York | $99,500 |
| North Carolina | $80,100 |
| North Dakota | $96,800 |
| Ohio | $83,300 |
| Oklahoma | $76,000 |
| Oregon | $91,800 |
| Pennsylvania | $90,100 |
| Rhode Island | $99,300 |
| South Carolina | $78,400 |
| South Dakota | $85,400 |
| Tennessee | $77,800 |
| Texas | $85,300 |
| Utah | $95,800 |
| Vermont | $92,800 |
| Virginia | $103,900 |
| Washington | $105,300 |
| West Virginia | $67,700 |
| Wisconsin | $91,000 |
| Wyoming | $88,900 |
| US | $90,000 |
Have you ever wondered where your income falls among wage earners nationwide? For example, you may be interested to know that if your household income is over $200,000 per year, you’re among the 11.9% wealthiest households in the country.
According to Statista, the income distribution in the U.S. is as follows (for 2022):
According to the U.S. Census Bureau, 11.5% of the population – or about 37.9 million people – were below the poverty line in 2022.
According to the U.S. Office of the Assistant Secretary for Planning and Evaluation (ASPE), the poverty line for 2023 is as follows (based on annual income by household size) for most of the country:
- One person – $14,580
- Two people – $19,720
- Three people – $24,860
- Four people – $30,000
- Five people – $35,140
- Six people – $40,280
- Seven people – $45,420
- Eight people – $50,560
Based on the table for “Median Household Income Per State” provided by the U.S. Department of Housing and Urban Development in the first section above, the top five richest states in the USA are:
- District of Columbia, $144,800
- Massachusetts, $120,400
- Maryland, $117,500
- New Jersey, $117,500
- Connecticut, $112,600
Based on the table for “Median Household Income Per State” provided by the U.S. Department of Housing and Urban Development in the first section above, the top five poorest states in the USA are:
- Mississippi, $65,000
- West Virginia, $67,700
- New Mexico, $68,700
- Arkansas, $69,400
- Louisiana, $72,400
Impact of Education on Earnings
Your level of education also significantly impacts your income. According to the Bureau of Labor Statistics (BLS), income per education level for 2022 is as follows:
| Education Level | Mean Usual Weekly Earnings |
|---|---|
| Professional Degree | $2,083 |
| Professional Degree | $2,080 |
| Master’s Degree | $1,661 |
| Master’s Degree | $1,432 |
| Bachelor’s Degree | $1,005 |
| Some College, No Degree | $935 |
| High School Diploma, No College | $853 |
| Less Than a High School Diploma | $682 |
| Average for All Education Levels | $1,341 |
Earnings by Age Bracket
According to the U.S. Bureau of Labor Statistics, median earnings by age bracket are as follows (for the third quarter of 2023):
| Age Bracket | Mean Usual Weekly Earnings |
|---|---|
| 16 to 24 | $714 |
| 25 to 34 | $1,040 |
| 35 to 44 | $1,263 |
| 45 to 54 | $1,272 |
| 55 to 64 | $1,222 |
| 65 and over | $1,128 |
Expenses and Debt: The American Financial Burden
Consumer Spending Patterns
Average annual consumer spending in the USA was $72,967 in 2022, according to the Bureau of Labor Statistics.
The biggest individual category expenses were:
- Housing, $24,298
- Transportation, $12,295
- Food, $9,343
- Personal insurance and pensions, $8,742
- Health, 5,850
Reality of Consumer Debt
The state of consumer debt in the United States is both substantial and multifaceted, as indicated by statistics from the Federal Reserve Bank of New York for the third quarter of 2023.
The total consumer debt has reached a staggering $17.29 trillion, encompassing home mortgages, student loans, credit cards, and auto loans. Drilling down into these figures, the nation’s credit card debt accounts for $1.079 trillion of this total.
On average, a family carries $6,120 in credit card debt, with 45.20% of American families having some level of credit card debt. The interest paid by the average American household on credit cards is a high 22.77% annually.
This figure suggests a potential lack of awareness among consumers about the total interest they pay due to the complexity of managing multiple credit cards and the fluctuating nature of balances and interest rates.
The issue of debt extends into the realm of transportation and education. Approximately 1.2 million car repossessions occurred in 2022, as reported by Bloomberg, typically within 90 days of a loan default.
On the education front, student loan debt has surged to a record $1.77 trillion at the outset of 2023, with about 45.3 million students and graduates owing an average of nearly $30,000. Parent borrowers have taken on an average debt of $37,200 to finance their children’s education.
Bankruptcy also features prominently in the American financial landscape. Annually, 418,724 Americans file for bankruptcy, with personal bankruptcies constituting 403,000 of that number.
Chapter 7 bankruptcies, which entail the liquidation of assets, accounted for 239,125 cases, signifying complete insolvency. The remaining 173,362 were Chapter 13 bankruptcies, often involving reorganization and installment plan settlements.
These figures provide a stark illustration of the financial challenges facing many Americans.
Savings and Financial Planning: Are Americans Prepared?
Savings and Emergency Funds
Recent surveys and financial reports shed light on the state of American savings and budgeting behaviors, painting a somewhat concerning picture of the financial stability of many households.
According to Statista, as of the latest data, 12% of Americans have no savings at all, highlighting a significant portion of the population potentially vulnerable to financial emergencies.
Further emphasizing this vulnerability, a 2023 CNBC survey revealed that 62% of Americans are living paycheck-to-paycheck. Alarmingly, this hand-to-mouth existence spans across income levels, including 10% of households with annual incomes exceeding $100,000.
In terms of financial planning, Nerdwallet reports that only 74% of Americans maintain a budget, suggesting that a quarter of the population does not actively manage their spending against their income.
This lack of financial oversight may contribute to the stark reality that fewer than half of Americans — under 45% — have sufficient savings to cover an unforeseen $1,000 expense.
Instead of having a financial cushion, many would turn to credit cards, personal loans, or family and friends for financial assistance in such scenarios. The consequences of these precarious financial practices become further evident in the amount Americans pay in overdraft fees.
In 2022, individuals paid out $7.72 billion in such fees, with the burden primarily falling on those already identified as financially vulnerable, according to the Consumer Financial Protection Bureau.
When examining the average savings per American family, there’s a vast discrepancy at the state level. As of 2023, the national average savings stood at $65,100.
However, this average does not reflect the financial health of all states, with Arkansas averaging the lowest at $1,664 and the District of Columbia the highest at $2,806, suggesting significant regional disparities in economic well-being.
Retirement Preparedness
The landscape of retirement savings in the United States varies considerably by age, as detailed in the 2022 Federal Reserve data. The median retirement savings for American households stands at $87,000.
However, when these figures are broken down by age, it becomes evident that younger Americans, specifically those under the age of 35, are at a different stage in their retirement planning, with a median savings of $18,800.
The benchmarks for how much an individual should have saved for retirement by specific age brackets are not universally fixed and tend to be somewhat subjective. The general guidance is predicated on one’s current income, presuming it is adequate to manage living expenses comfortably.
This income is then multiplied by a certain factor intended to result in a sufficient nest egg by the time one retires at age 65. For instance, by the age of 40, it is suggested that one should have saved approximately 1.5 to 2.5 times their current annual salary.
As individuals progress through different age brackets, the recommended savings multiplier increases to ensure that retirement savings grow in proportion to the approach of retirement age.
American Financial Landscape: A Comprehensive Overview of Savings, Budgeting, and Retirement Preparedness
| Topic | Statistics |
|---|---|
| Savings Snapshot | • 12% of Americans Have No Savings • 62% of Americans Live Paycheck-to-Paycheck, Regardless of Income Levels |
| Budgeting Habits | • Only 74% of Americans Maintain a Budget • Less Than 50% of Americans Have Sufficient Savings to Cover an Unforeseen $1,000 Expense |
| Emergency Fund Reality | • Less Than Half of Americans (Under 45%) Have Enough Savings for a $1,000 Expense • In 2022, Individuals Paid $7.72 Billion in Overdraft Fees, Primarily Affecting Those Identified as Financially Vulnerable |
| State-Level Savings Disparities | • National Average Savings: $65,100 • Arkansas Averages the Lowest at $1,664, While the District of Columbia Tops the List at $2,806, Indicating Significant Regional Disparities in Economic Well-Being |
| Retirement Savings Landscape | • Median Retirement Savings for American Households: $87,000 • Median Savings for Those Under 35: $18,800 • Recommended Savings Multiplier Increases With Age for Retirement Planning |
The Bottom Line – Personal Finance Facts and Statistics
The landscape of personal finance in the United States is as diverse as its population. Median household incomes fluctuate significantly across states, revealing a country of economic contrasts.
Education continues to be a powerful determinant of earning potential, with higher levels of education correlating with increased income. However, despite reasonable earnings, many Americans are burdened with considerable debt and lack the savings necessary to weather financial emergencies.
The state of retirement savings varies widely by age, emphasizing the need for early and consistent financial planning. The statistics presented underscore the importance of financial education and the development of robust personal financial management skills.
They highlight both the challenges and opportunities that lie within managing personal finances, pointing to a need for individual responsibility and systemic solutions to support Americans in achieving financial stability and security.
The post Personal Finance Facts and Statistics appeared first on Good Financial Cents®.